Blog 5: Reflection on our Final DH project

As our experience with digital humanities is coming to an end, this final blog will show how the combination of two different worlds: humanities and technology helped us throughout our journey.  

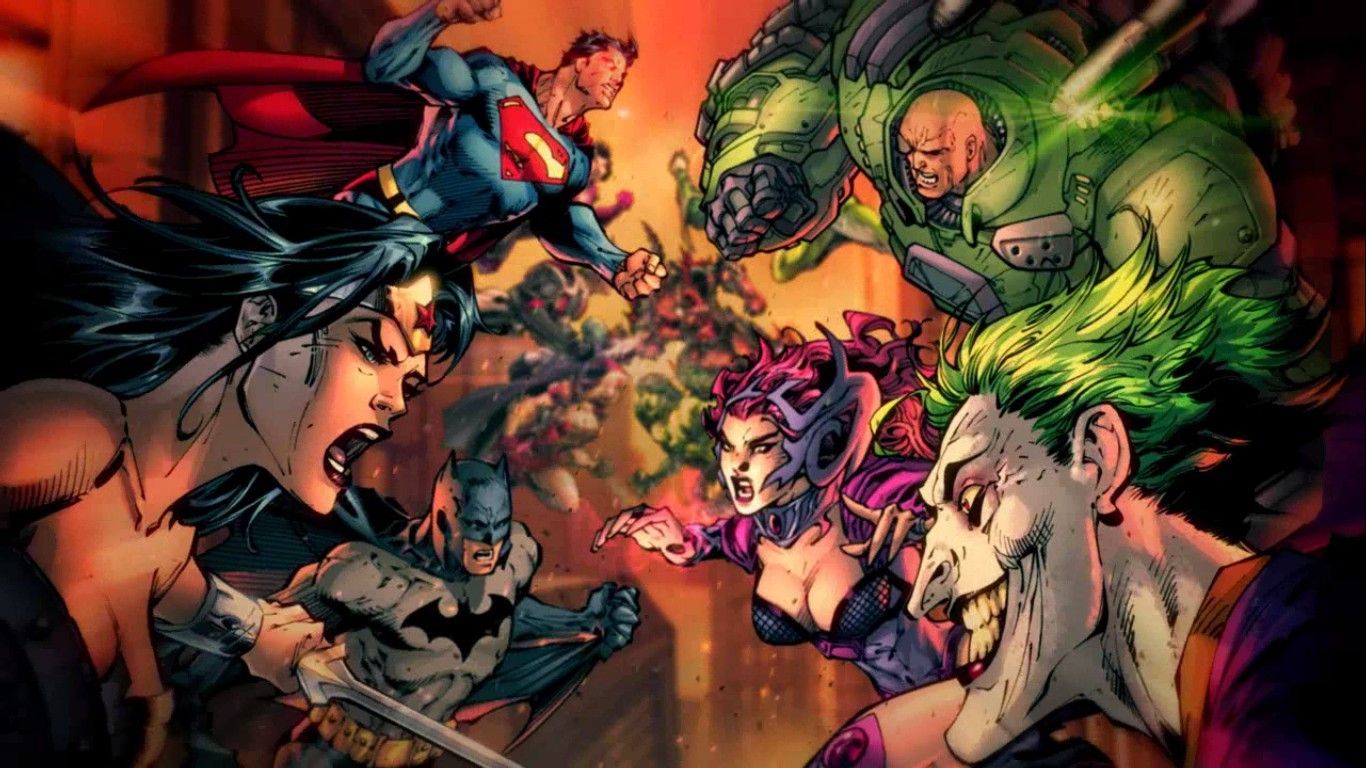
To start with, the class was divided into groups where each group chose an author or a topic to base the whole research on. The three of us barely had any topic in mind. However, one of the topics we stumbled upon and found very interesting was Heroes vs. Monsters! Therefore, we decided to base our project on this topic, especially that there’s been a recent focus on this topic demonstrated in movies and documentaries. As our proposal suggested, our main goal was to create a timeline in order to showcase and visualize the evolution of the villains’ behavior throughout time and how it’s justified in today’s world. We started by gathering information about the most famous villains in the past era and in today’s world and compare how their lives were portrayed back then and now, and how society shaped them into becoming the villains they are now.  For instance, we highlighted major events in Batman and those in The Joker where the same characters are portrayed in different ways to deliver differing messages.

Regarding working together as a group, we were very efficient, organized, and motivated. We distributed the tasks equally amongst us to be more coherent; the three of us had a say in every task assigned which positively affected the project’s outcome. Let us introduce ourselves! To start with, my name is Ghida Allam, a third-year Accounting Student at AUB. My teammates are Alexia El Alam and Joseph Abboud. Both Alexia and I are business students. Joseph is an Economics student. We all have similar interests in terms of books and movies, which make our work very interesting and exciting.

The title we chose for our project was “Heroes vs. Monsters: finding a Hero in every Villain”. This title projected the main goal behind our project. Initially, the theme was very broad (i.e “Heroes vs Monsters”) and so throughout our analysis, we realized that we were leaning more towards justifying the evolution in the perception of villains. We wanted to show a critical contrast in the way people perceived Heroes and Villains in the past and in more contemporary time periods. We shed light on the difference between how the villain was perceived as the “bad guy” and the hero was perceived as the “good guy” in older literature texts, while in today’s world the villain is becoming the hero himself and whose actions are justified by society’s cruel actions. Based on the overall analysis we prepared throughout the semester using DHL tools, we managed to achieve concrete results that showed this revolution of villains throughout time.

We were also capable of reflecting on our own opinion regarding the topic. It was much more interesting for us to relate to the topic because all of us are big fans of hero and villains books/movies. Therefore, each one of us gave an example of his favorite hero/villain and had the opportunity to analyze his character using DHL tools. 

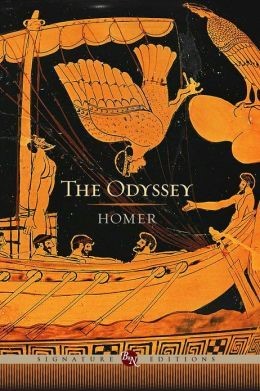
During this semester, our knowledge grew regarding the aspect of how important the villain is for the Hero to exist. With all our blogs related to the theme “Heroes vs Monsters”, our final project (TimelineJS) tackled the evolution of how the villain was portrayed through time, from the Greek mythology to the present. Regardless of how monstrous and abnormally strong the villain/monster is described in Greek literature (The Odyssey by Homer for example), we learned what their real value was then. The role played by the villains in Greek myths was secondary and inferior to the “Hero”, the villain is present to glorify the Hero’s achievements and victory over the enemy. 

Moreover, when it came to the mid 1900’s we knew the importance of propaganda during the war times and the use of articles, books, art and cinema to win the ideological war. But what we did not know was the depth of how comics were used. Especially when it comes to the usage of our theme “Heroes vs Monsters”. The DC comic world influenced millions of Americans and others during the war. Comics were first used to describe the enemy (The Nazis or the USSR), and with the success of it, the government started using comic books to encourage people to join the army, buy war bonds, strengthen the morale of troops as the number one customer of comics was the army itself. After all, from books to comics, literature played a huge role in the outcome of the war by playing with the people’s mind and ideology, directing them to the American way. 

Add more things about 21st century books/texts and their relation to the theme 

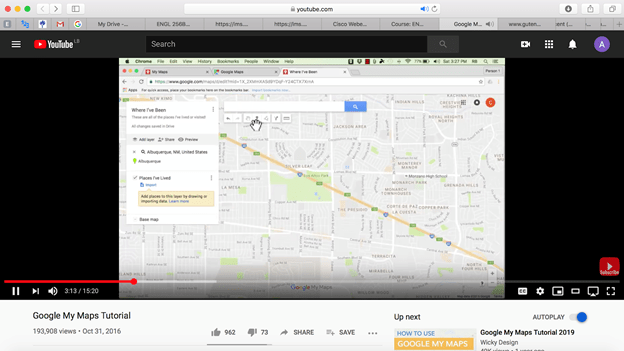
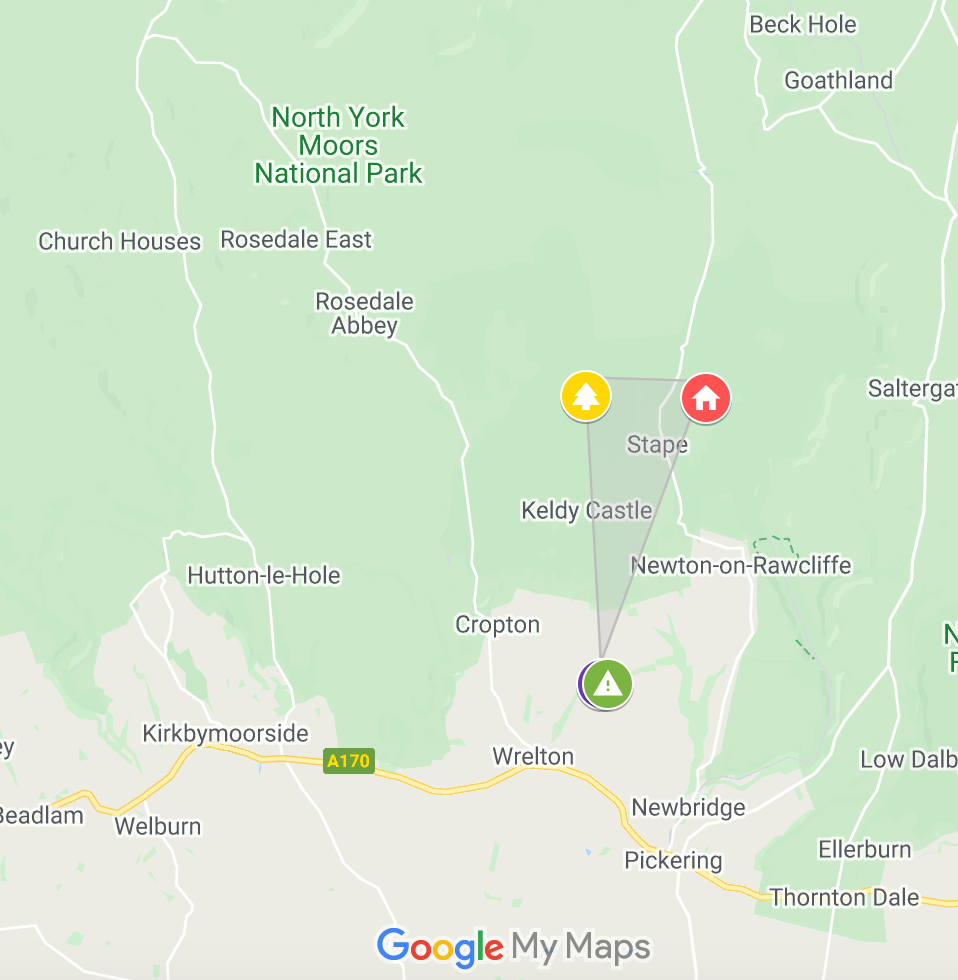
Google my maps was the perfect tool to illustrate the use of comic books during the war time. This digital tool helped us map with precision the targets of comics in propaganda. In the series of Captain America, we mapped the most important use of the comic for propaganda, located in the U.S. ; Encouraging people to join the army, boost the troops morale, boost the army economy and direct people onto the right ideology. Secondly, we were able to showcase the other use of the comic, by showing who is the real enemy. Located in Germany and Russia (Nazi Germany and the USSR), we mapped the different villains that was used in the comics as the arch enemy of Captain America. Some direct, like the powerful image of captain America punching Hitler. Or indirect, like characters disguised as Russian spies or as Hitler’s successor ready to annihilate the United States and the world. Funny how the villain’s nationality matched with the arch enemy of the U.S during WWII and the Cold War. 

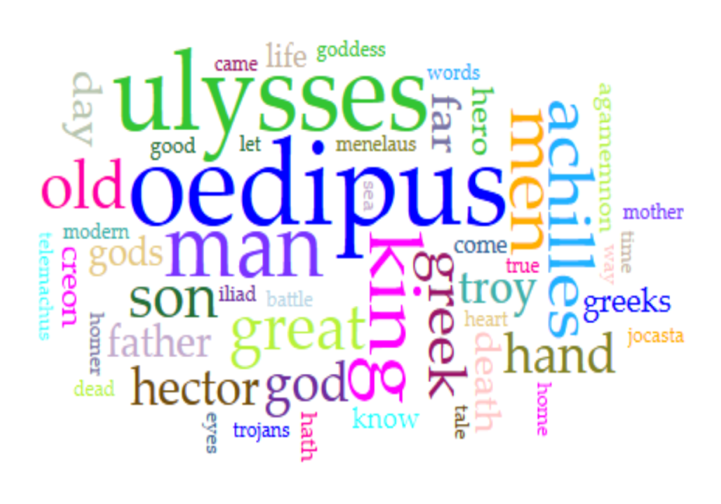
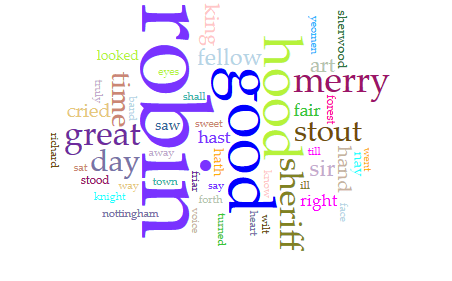
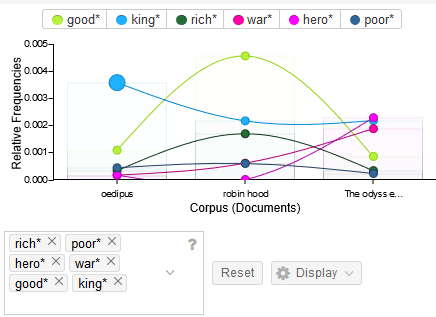
We associated the corpus and the close reading we established using Voyant Tools to show the most repeated words that serve our major purpose in relevance to our research questions and to our analysis as a whole which is justifying the villains’ actions. 

Finally, TimelineJS was the perfect tool for our project as we wanted to show the evolution of the Villain compared to the Hero through time. We used Timeline JS to consolidate our analyzed information and display it in a more professional yet interactive way, easing the communication between us and the class. To conclude, all the tools we used throughout our journey were extremely helpful in proving the validity of our research questions and in achieving our set research goal. 

We were successful in achieving the goals we set for our project. This project allowed us to confirm that heroes have effectively changed a lot throughout time; while in the past the villain was considered the “bad guy”, in today’s world the villain’s actions are becoming more and more justified making him a “good person but shaped by society’s cruel treatment”. This revolution illustrated a major difference in how people perceive and differentiate between the good and the bad.

You can check our timeline on the following link so you can visualize our DH project which we are very proud of: https://cdn.knightlab.com/libs/timeline3/latest/embed/index.html?source=1FzumdDEjK7COlI3h4BnVefIOngYQKoB7mcq-h-rHmoM&font=Default&lang=en&initial_zoom=2&height=650

This blog was written by Alexia Al Alam, Ghida Allam, and Joseph Abboud.

BLOG 4: Experiences with TimelineJS

By what means do you usually present information and facts?  Through PowerPoint maybe? Too mainstream…

Have you ever heard of Timeline JS?  It makes the perfect substitute. It’s a Google spreadsheet that presents events in chronological events and presents information in a way that makes it visually rich through an interactive timeline. Created by the Knight Lab at Northwestern University, the tool can be used in many disciplines and is particularly useful for digital humanities projects.

To have an idea here’s a picture that shows the spreadsheet you need to work on to create Timeline JS: 


Template: Scheetshot of TimelineJS Google Spreadsheet (default view)

It might look complicated, but believe us it’s not at all. Timeline JS is very user-friendly. The templates are ready; therefore, all that you have to do is insert the texts in one column as shown in the table above, and it will appear on the timeline in a structured and organized design, easy for the reader to swipe through from slide to slide across the timeline.

One thing that makes Timeline JS really unique is its chronological narration. Dates are inserted in columns specifying the date, the month, and the time then presented digitally in a very sophisticated way. Also, it allows you to include different types of media to convey your message like Pictures, SoundCloud, Twitter, Youtube, Gifs, Google Map, and many more just by inserting their link on the spreadsheet. Other unique features include changing the background of the slide using some codes and adding as many slides as you need. Among its qualities are the sole requirement of a Google account to use it and its easily shareable and embeddable format. 

Things to keep in mind: Only two fields in the spreadsheet are ultimately required: Start Date and Headline. In addition, it is very useful to use the Media and Text Fields. Be sure to use the Media Credit field if you’re not using your own material. The Media Thumbnail field is less useful. It is very important not to delete or amend the first row of the spreadsheet. The fields must stay in the same order for TimelineJS to process the data.


via Digital Humanities at Washington and Lee University 

Despite its advantages, TimelineJS has some disadvantages. The tool is only accessible with connectivity to the internet – which presented a bit of challenge, especially when living in our area of the world.  Also, some may argue that the page format is very static and fixed. One of the more confusing aspects of TimelineJS is understanding how the seven fields in the provided spreadsheet map to what is displayed on the timeline. It displays the images and the texts in a designated area that cannot be changed, so it’s a problem as we couldn’t customize the area or the size of our media inserted.  Finally, the last disadvantage of TimelineJS is that it may require some trial and error. As beginners, we had to try all the different settings and incorporations of multimedia (such as soundcloud, gifs, images, maps,…) to become familiar with the template and layout of this tool. It might seem challenging, but talking from experience, once you get the gist of it, it becomes very structured and easy to navigate. 

At the beginning of our Digital Humanities course, as a team, we believed we would be delivering our final project on conventional tools such as PowerPoint. However, when TimelineJS was introduced to us, we were fascinated by the “newness” of it. No other course we had taken allowed us to use and test such a tool. We thought it would serve our vision to clearly present our analysis within different timetables.  Also, the fact that we are able to incorporate different media in our timeline guided us into achieving our goals of making our presentation tell its own story by quickly and easily interacting with readers.  

While we were still learning about this tool, the offered media we applied served a whole lot in grabbing our attention and keeping us interested in reading more about the topics presented. The most important thing that distinguishes TimelineJS from Powerpoint in our opinion, and from the experience we gained from both, is that the content in TimelineJS is viewed without any interruptions – to open a certain link or access a hyperlink – that are more likely to occur on Powerpoint. Links are there as an added source in case the reader would like to read or do extra research on the side. 

Our team’s main focus was to chronologically showcase the evolution of the villains’ appearance and behavior throughout time. So we will be using it to storytell the information we gather about our books/texts in a visually rich, entertaining and engaging manner. Our project on “Heroes vs Monsters: Finding a hero in every villain” contains images, videos, GIFs, maps from Google My Maps and soundcloud clips based on books/texts we are analysing.


Screenshot of our TimelineJS Spreadsheet file

TimelineJS aims to present a story about events in current or recent history. Of course, the purpose of any timeline is to visually convey information; TimelineJS does that through merging the timeline feature with the options of media, audio, video, and attractively formatted text. This tool helped us expand the scope of our tasks through those unique attributes. For instance, we will be using Google My Maps to highlight major points like the proximities between the events in Batman (comic written in the 1950s-1960s) and those in The Joker (published in 2019) where the same characters are portrayed in different ways to deliver differing messages. Our readers will be able to see the map we will create through the media field. Also, in the theme we chose for our project feelings and emotions play a big role in delivering information. For instance, when a character is associated with ultimate strength and/or revenge, the colors we would be able to incorporate in the background of our slide will help in delivering our message in a more interactively visual way. 


Screenshot of our TimelineJS

In conclusion, TimelineJS helps us convey our ideas clearer by displaying information and events in a visually rich and interactive way that grabs the audience’s attention. Using this tool will definitely enhance our topic’s presentation and make it much more interesting. 

One tip we would like to give you is: before diving into the spreadsheet you may want to prepare a storyboard for your timeline. While you can do this on the spreadsheet, doing so earlier on paper can help organize your thoughts and the story you’re telling through the data without the distraction of the spreadsheet and the software. Then, when you have all your data organized, you can see how it fits together through the TimelineJS Spreadsheet more easily. 

We are sure that by now you became interested in using it to create your own timeline. Click here http://timeline.knightlab.com/#make to create yours now. 

This blog was written by Alexia Al Alam, Ghida Allam, and Joseph Abboud.

Mapping Literary Texts with Google My Maps: Bringing Fantasy to Real Life

Google My Maps is an application used to create customized maps online, as a visual data-organizer, allowing researchers to view their data in a map on their research material. As a mapping application in general, it is extremely beneficial for analyzing texts with real locations. As you will see, Google My Maps can also bring fantasy books to life by helping us locate real places to the settings of fantastical stories. This tool could be used to map the different books people read over time, and help locating places mentioned in those books. It, therefore, allows you to have a clearer understanding of the texts you are reading and a nicer picture to the events occurring in those books. It has so many interesting features, including colors, icons, videos and images to help mark a specific location. It allows you to customize and personalize the locations identified which is even more interesting. 

In this blog, we will be taking you on our journey encountering Google My Maps for the first time. We first decided to watch the following tutorial on youtube.com: Google My Maps Tutorial(https://www.youtube.com/watch?v=fLhyr5MGi2g&feature=youtu.be). It is a very helpful one as it clearly explains all the features that could be used in Google My Maps and the different use cases for this tool. After carefully learning the instructions from this tutorial and due to the current lockdown situation in Lebanon, we created a Google My Maps sheet and shared it among us three. Then, we each created his/her own layer and started experimenting with places and locations relevant to our topic. In parallel, we discussed our findings and analyzed their relevance to the theme which we adopted: “Heroes vs Monsters”. The following link will take you to the mapping of our literary texts using Google My Maps: https://drive.google.com/open?id=1mWyNP9WNqhLXfIyBpJR9cQoMYSoDr1al&usp=sharing

Screenshot of Tutorial for using Google My Maps via Youtube.com

As per the latter, we decided to work on four different texts/books: “Sleeping Beauty” by Charles Perrault first published in 1694, then filmed by Disney in 1959. We put its analysis in contrast with “Maleficent”, the counter-story portraying the villain of the latter as the protagonist of her story, filmed by Disney in 2014. Then we looked at “Batman” of the 1960s and put it in contrast with “The Joker” drawing attention to the then-villain in Batman, published in 2019. We closely read the texts from Gutenberg.org, DC Comics and IMDb (https://www.imdb.com/title/tt1587310/plotsummary). 

The texts/books that we chose for our Google My Maps assignment are all from different authors and include undermined spaces or places of action which are not normally seen in the world. However, to our surprise, we found that most of the spaces mentioned in the stories actually do resemble earthly spaces, such as Gotham City found in both Batmanand The Joker. This location is actually a city in New Jersey, US. Also in Maleficent, the main character, Maleficent herself rules over a kingdom/magical forest called the Moors Forest in the text/film. There effectively exists a Moors forest in North York, UK.  Therefore, we speculated that the events of those stories all happened in or near those real-life locations. 

To pin our locations we decided to use icons that reflected the scenery and colored them using the Plutchik’s wheel of emotions.

Pultchick’s wheel of emotions vs researchgate.net

Through the mapping exercise of Sleeping Beauty and Maleficent, it became evident that both stories occur in the eastern part of the world, most precisely in Europe. The narrative of Sleeping beauty takes place in France, Avignon. This assumption is based on further research on that book that shows where the main events of that story happen (source:https://www.radiotimes.com/news/2015-09-04/this-google-map-shows-where-your-favourite-disney-films-are-set/). The zones of action in Maleficentare spread over the area between the forest, the castle, the dungeon of the castle and the cottage. They are somewhat distinct and each representative of a phase in the story (e.g. cottage = where Princess Aurora was raised until her 16th birthday and where Maleficent would visit from time to time). In contrast, when mapping the zones of action for Sleeping Beauty (an older version focusing on Princess Aurora as the main character), we realized that most of the events happen in the same space: the palace. The forest is no longer on the border of the kingdom, but it surrounds the palace as a form of protection from the outside world (while the princess was in her 100 years slumber). This story focuses its actions in a narrower space to shed the lights on the importance of that location relative to the message of the story. In Maleficent, all locations mentioned meant something to the Heroine (formerly considered a villain in Sleeping Beauty). 

Regarding the mapping of Gotham City, for the series of Batman: at the beginning, the map doesn’t really appear as either “true” or “accurate” as we expected it to be. Regarding the mapping of Gotham City, for the series of Batman: at the beginning, the map doesn’t really appear as either “true” or “accurate” as we expected it to be because Gotham city is fictional and all we know is that it could be in New Jersey, US

(https://en.wikipedia.org/wiki/Batman_(1966_film)  – https://en.wikipedia.org/wiki/Joker_(2019_film)https://en.wikipedia.org/wiki/Gotham_City).

By looking closely into Gotham and the details of the story of Batman, we tried to map the most iconic monuments and places in the Batman Series

As a final result, Google my maps helped us create and understand more about Gotham city and the adventures of Batman. By mapping all the iconic sites within exact distance of each other (for example, mapping the “Blackgate Penitentiary” 12 miles from the “Arkham asylum” or “CRIME ALLEY”; The worst moment in Batman’s life came when the young Bruce Wayne saw his parents shot and killed by a mugger, which happened in Crime Alley) you get a more concrete image of the city. All the time imagining the places, alleys, buildings that Batman interacts and adventures himself in the books, they become clearer in your mind. 

So, by mapping those childhood memories on a 2D platform, we experienced a batman story in a different way. Placing and mapping all of batman’s path and event restructured our mindset about the events and gave a deeper understanding about all the challenges batman encountered in Gotham city. The fact that the setting of that story were actual places in the real world lifted our interest in the character and his story and directly made us want to know more and probably visit those real life places someday. Google My Maps brought fantasy to the real world and this is why our experience with it is exceptional.

To be able to map all those fictional locations on a real map, we mainly relied on Wikipedia to search the most relevant places in the DC world, especially for the Batman Series and The Joker: “Gotham City is traditionally depicted as being in the U.S. state of New Jersey. Over the years, Gotham’s look and atmosphere has been influenced by cities such as New York City and Chicago.”

 We were able to locate to real locations that have been used for the batman series: 

  • Wayne’s Manor: It’s just up the M42 motorway from Birmingham. That’s because Wollaton Hall in Nottingham is the real-life Wayne Manor, and appears in The Dark Knight Rises blockbuster. Bruce Wayne’s place of residence is Wayne Manor, which is located on the outskirts of the city. His butler, Alfred Pennyworth, aids Bruce in his crusade to fight crime in Gotham.
  • The Batcave: The actual cave that the Batmobile is shown emerging from (and sometimes entering) in the TV show is in the man-made filming location known as the “Bronson Caves,” in Griffith Park, below the Hollywood Sign. The Batcave is a secret underground base for batman. All of his vehicles and advanced weaponry and gadgets are all in that same place including his famous armor and mask along with the Batmobile. This said, the Batcave has a secret entrance as well as secret exits so that batman always is unnoticed.

Google My Maps has many advantages when it comes to the presentation of the material. Firstly, it is straightforward and user-friendly. In our case, we used it to map out a set of events happening at fictional places. So, we as users had to change the headers, add descriptions respective to our research and the data we wanted to present and mark the locations. After marking the locations, we had to link emotions – an interesting feature; for instance, anger could be highlighted in purple, etc. Such a feature allows a more personalized experience for the user and for the audience later on. We would highly recommend using it to enhance a presentation as it makes it more appealing to audiences.

Since Google My Maps is very beneficial as it allows us to infer complex relationships between the inserted information and make them clearer and more relatable, we will use it to show the relationship between series of events leading to a certain outcome related to our theme. For example, using Google Maps in narrating the story of “TheJoker” has showcased all the significant series of events in the story clearly; highlighting the important part of it; thus, making it clearer how all the events have contributed to turning him into the man he is today; also, making him the hero of his own story. In conclusion, this tool made us believe again in the realness behind every fictional story and the relatable events that can lead a person to behave the way they do – which results in them being looked at as either heroes or monsters (i.e. villains).

Done by: Alexia Al Alam, Ghida Allam, and Joseph Abboud

Blog 2 : My Experience with CLiC and Voyant Tools

Think about your favorite character. Is he a superhero? Or is he a narcissistic philanderer in ad sales? Do you root for the man cooking the meth or the DEA agent trying to stop him? Do you root for the savior or the criminal? You’ve probably seen and heard about the “Joker” Movie that broke Worldwide B.O. record for R-Rated film with $788 million +. The movie talks about the crazed Batman nemesis and sheds the light on his origins and history. While in the movie “Batman”, Batman was himself the so-called hero, while in the “Joker” the movie, joker tended to be the hero that had a monster within himself. 

Every hero needs a to confront a monster or villain to be the protagonist he is. A hero can also have a monster within himself, and battle a psychological and emotional war, or can be challenged materially and physically.

In this blog, we will introduce digital humanities tools such as CliC and Voyant in reference to our topic “Heroes vs Monsters”. We’re going to focus on how the concept of heroes and monsters have evolved through time since Greek mythology to our modern days and how that evolution has tremendously affected their appearances. First, we will be introducing you to the world of CLiC and Voyant in addition to the corpus that we used.

The corpus created for CLiC and Voyant Tools is made up from “The Odyssey” (8Th Century BCE), one of two major ancient Greek epic poems written by Homer, and the Greek tragedy by Sophocles “Oedipus Rex” (5th Century BCE) and “The Story of Robin Hood and His Merrie Men” whichwas written by Howard Pile (1952). We extracted these texts, in their plain form, from “Gutunberg.org”.

These texts exemplify perfectly our theme “Heroes vs Monsters” in the different ways we’ve previously mentioned. The first way a monster is demonstrated is within the hero himself, and this was clearly exemplified through Sophocles’ tragedy, as the story, “The Odyssey” narrates about Odysseus. Although he is seen as an epic hero for his role as King of Ithaca, Odysseus is also considered to be a monster, based on the standards of mercifulness, because of his actions of sacrificing his men, killing the suitors and being ruthless throughout the Odyssey. He was one example of a hero having a monster within himself.

The initial questions we have asked ourselves before exploring the texts are the following: How does each text portray the theme “Hero vs Monster”?  How do these texts differ in depicting the “hero” and the “monster” or “villain”? And, how did the portrait of “Hero vs Monster” evolve over different timetables?

 CLiC

Finding the texts on CLiC (http://clic.bham.ac.uk/) was somewhat difficult as the tool does not have any of these books embedded into it. However, a nice trick we learnt in class was to access the Gutenberg library, a free online library where the texts could be found in full plain transcript. We could then upload the latter on the Voyant tool and finally let it do its wonders. Moreover, and in order to explore the CLiC tool, we decided to analyze “Alice in Wonderland” by Lewis Carroll. We went with this book in particular as it stages the “Heroes vs Monsters” theme with Alice being the Hero of the story and the Queen of Hearts being her main antagonist. The latter falls in the imagination of the former (mental confrontation) and is a “a blind fury” who always commands death sentences at the slightest offense. The heroine, Alice, appears looking like herself, only smaller than usual (“small” and “little”). The Queen seems to have a large head, and a short tempered character, but does not confront the heroine physically. The word “mad” (mentioned around 14 times in the text) is associated with mental illness which reflects the state of mind Alice found herself in.

When using CLiC, we frequently referred to the concordanceand Keywords feature. In all subsets, we selected the all textoptions. The reference corpora were ChiLit or Childen’s Literature. Then, in order to answer the first question, we searched for the words “little” and “mad”. Regarding the second question, we entered the names Alice and The Queen and found their frequency of appearance in the text and the situations or context in which both are pictured.

../Screen%20Shot%202020-03-18%20at%2012.52.38%20PM.png
A look on the digital platform CLiC

Voyant

Moving on to Voyant, we began by observing the Cirrus cloud displaying the words which appear the most in the text. We we paralleled both texts in one corpus, the exact same words stand out as the most frequently used according to Cirrus. The cloud showed that the most frequent words are “Ulysses” (239 times), “Oedipus” (267 times), “Hero” (177 times), “Good (548 times), “Love” (104 times), “God” (318 times), “King” (473 times), “War” (213 times) and “Monster” (11 times), “Fight” (28 times), “Rich” (219 times), “Poor” (91 times), “Villain” (14 times), “Money” (97 times). In addition, we did not change the stop words options in the cloud since we did not see any words such as “the”, “and” or “for” that scrambled the results of the Cirrus search. Additionally, the summary tool did not contribute much since it generated similar results as those of the cloud in the category distinctive words. In the trends categories, we employed the graph of the frequency of each word throughout the texts.

Each tool has helped in answering the team’s research questions. The cloud began by giving us a sense of which words appeared the most in the text. The phrases category shed light on significant sentences presented through each text and the corpus as a whole. Likewise, the trends graphs allowed us to view the trend of words over time: Word trends show how the work/theme has evolved and how writers started (or stopped) using specific words. Therefore, this feature helped us analyze the frequency of a given word throughout time (8th century BCE to 5th century BCE) and its utilization through the corpus.  Thus, the trends were a clearer way to analyze the word count since it shows the variation in frequency of a single word depending on the segment of the corpus.

Concerning The Odyssey, we began by distant reading the text through Voyant. Then we moved to reading a few chapters of the book and detected why some words such as “Ulysses”, “Love” and “Hero” appear so often. Though, most of the ideas we understood then directly relate to the main objective of the text which had been already stablished from distant read. The same tactic was employed with Oedipus Rex and Robin Hood.

Results

The “The Story of Robin Hood and His Merrie Men is written in a different era of literature than the other two.

Compared to the “The Odyssey” and “Oedipus Rex”, the hero in the story of Robin Hood is displayed differently and has a different purpose in the storyline. In “The Odyssey”, the hero had to prove himself and show-off his physical strength by going on a challenging adventure and battling monstrous creatures. In “Oedipus Rex”, the king who is also the hero of the story, struggles from a mental battle that has fated to kill his father and marry his mother, a different kind of war that the one Ulysses combats.

In Robin Hood, at that moment of time, the idea of a hero had been changed. Robin Hood is considered a “Hero”, not for his physical appearance or strength, nor for his role as a king, but because of his courage in the “Rich”. He works hard at defending the lower-class matter and working for the good of others.

Feedback on CLiC and Voyant

CLiC and Voyant are both online tools used for gaining an in-depth understanding of uploaded texts. They can be used for literary texts to gain new insights into how readers perceive characters and stories, however, each one has its own unique experience associated with the pros and cons.

Voyant is one of the tools that grant the best outcomes at ease. It allows researchers to understand huge collections of documents that are large for close-reading. Using it was very straightforward and user-friendly, evidenced through its ability to export data, extensive documentation, and simple user interface. First, the Voyant documentation website (http://docs.voyant-tools.org/) contains an explanation of resources for those seeking information. Tutorials are available for screencasts, screenshots, and using texts to make things easier for us as users. The simple interface is another user-friendly feature of Voyant, it is exhibited in the panels on the data analysis dashboard as well as the single data-entry field. The aforementioned panels have different text analysis tools that can be configured according to user preference. In addition to that, Word trends and frequencies can be examined, allowing the user to gain statistical information. Complementing Voyant’s user-friendliness is its ability to export data. Users have the choice of creating a link to retrieve the complete dashboard and corpus they’re analyzing at a later time so that no data will be lost. Also, Voyant is compatible with a wide range of document formats like HTML and plain texts, and it is easy to play around with tools simultaneously. Some limitations of Voyant Tools include the occasional prolonged text-loading time because its software is still in beta mode or sometimes gets stuck loading.

However, CLiC allows users to explore books and novels, mainly from the 19th century which makes it a bit outdated. It lets users search for particular words and phrases, study them in context, see how they are distributed across texts, and compare different texts with one another lacking any kind of visualization and the required analysis for the user. Voyant offers much more in terms of information analysis and utilization. Some added features suggested for CLiC include more analysis functions to assist the user and some visualization tools like tables and charts.

The main difference between distant reading and close reading first lies in the number of books read. Using CLiC and Voyant tools will get the work done in the fastest and most structured way possible when close reading might take forever. Another advantage of using these tools is objectivity, there are no emotions involved in the analysis, which might not be the case in close reading where every pupil analyzes a text with a different opinion. Another advantage of these tools includes allowing the user to find word frequencies, study word usage, and analyze the tone of the characters. Distant reading operates as a more scientific addition to the normal reading. However, sometimes distant reading is considered to impose a threat to what has been the core value of the (literary) humanities because it’s removing the human one step from the reading and turns literature into data and, in doing so, strips it of what distinguishes it.

Group 3 : Joseph Abboud, Alexia El Alam, Ghida Allam

Blog 1 : My journey with the digital world

Encounters with the digital world

There are no specific definition for digital humanities, in general it is an academic field concerned with the application of computational tools and methods to traditional humanities disciplines such as literature, history, and philosophy.

Being born in the late 90’s I experienced the evolution of digital humanities during my whole life. The instruments used like computers or portable phones shaped a part of my life. Growing up I think I used digital humanities 40 to 50 percent during the day ; for example, computers to study and do my homeworks, afterwards I play video games or listen to music and finally at the end of the day I watch TV during dinner.

My first encounter with digital devices was through my parents. My dad had a PC and a PlayStation that I enjoyed using for games. Growing up, I frequently used digital devices (PCs, Gameboy, PlayStation, iPod and tablets). At first, I used them for entertainment mostly playing games. And with time and advances in technology, these devices were more present in my daily life for many purposes such as sending emails, researching information, streaming videos and getting in contact with people.

School introduced to me a new door, new ways of using digital devices for researches, streaming videos, reading the news, excel, word and PowerPoint for presentations. Digital devices now play an important role in how I learn and accumulate knowledge.

My first experience joining an online community was through Facebook. I enjoyed joining groups that reflected my interests such as the Manchester United football club fan page where I could interact with people who shared my passion. I also began joining online gaming communities and my friends and I would share our achievements at school, for example, in expanding our “farms “(in Farmville city on FB). As we grew older our gaming interests became more varried and we would discuss games on the computer or on video game consoles, such as Call of Duty or FIFA and many more…


Social media Hours per day
Instagram1
Twitter 0.5
Whats app1
Facebook0.8
Soundcloud2

I recently created an Instagram account and am following friends and also my favorite DJs, producers and record labels. I joined twitter in 2012, at first I was an active user and I used to tweet a lot, but nowadays, I use twitter as a tool to gather information by following several news outlets.

Facebook used to be my go to platform to socialize with people and I used to rely on its chat feature but I now use it to be aware of events around me.

I love listening to music and Soundcloud is my favorite streaming platform. I stream music when studying, relaxing, playing video games and through Soundcloud, I can find some of my favorite songs that don’t exist on other platforms.

The use of digital humanities helped me a lot for my education, making research and presentation much more easier. Also, making learning and studying more interactive and interesting. Furthermore, digital humanities slietly shaped a part of me with my social skills too. Because when you see all these different platforms created during the years, you feel that you are now more connected with others and you also feel the urge to use these platforms sometimes to talk to someone instead of doing it personally face to face.

For every kids from the 90’s and 20’s, digital humanities is without a doubt part of them in life.

Design a site like this with WordPress.com
Get started